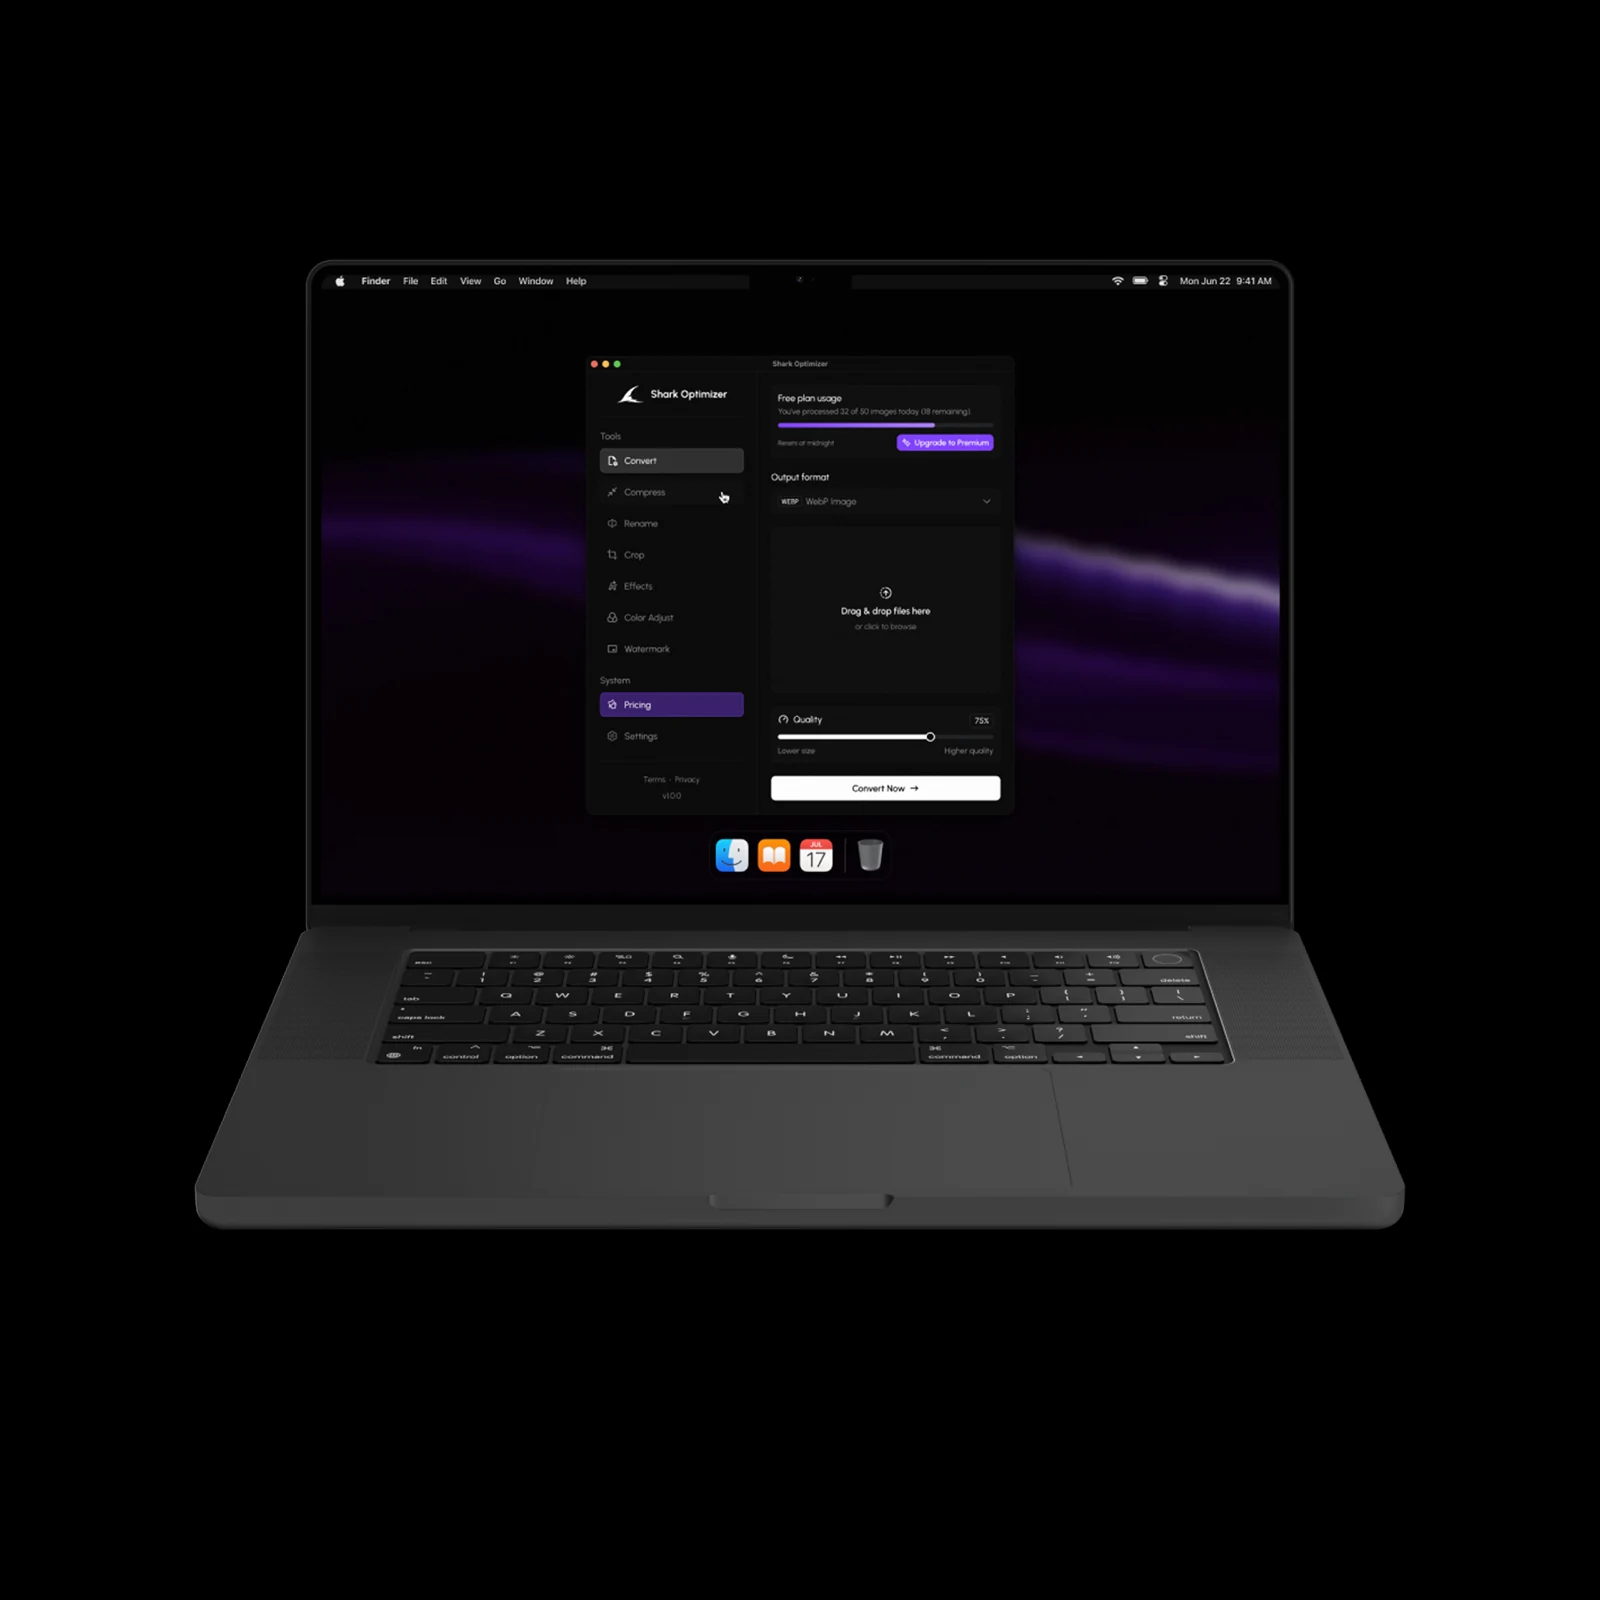
Daily Nutrition
A mobile nutrition log combining a daily overview, meal entry, a personal plan and exercise logging.
↓
Daily Nutrition
UX/UI design
Product development
Evolution of the supplied brand
Publication and release
3–6 months of post-launch support
Help a person understand the day at a glance and find the right entry action without navigating a dense menu.
The client brought the brand. We developed its expression within the product, designed the experience and built the application. Our engagement continued through publication and a 3–6 month support period, with refinements informed by usage and client feedback. Further support was a separate service.
Decisions you can see in the product.
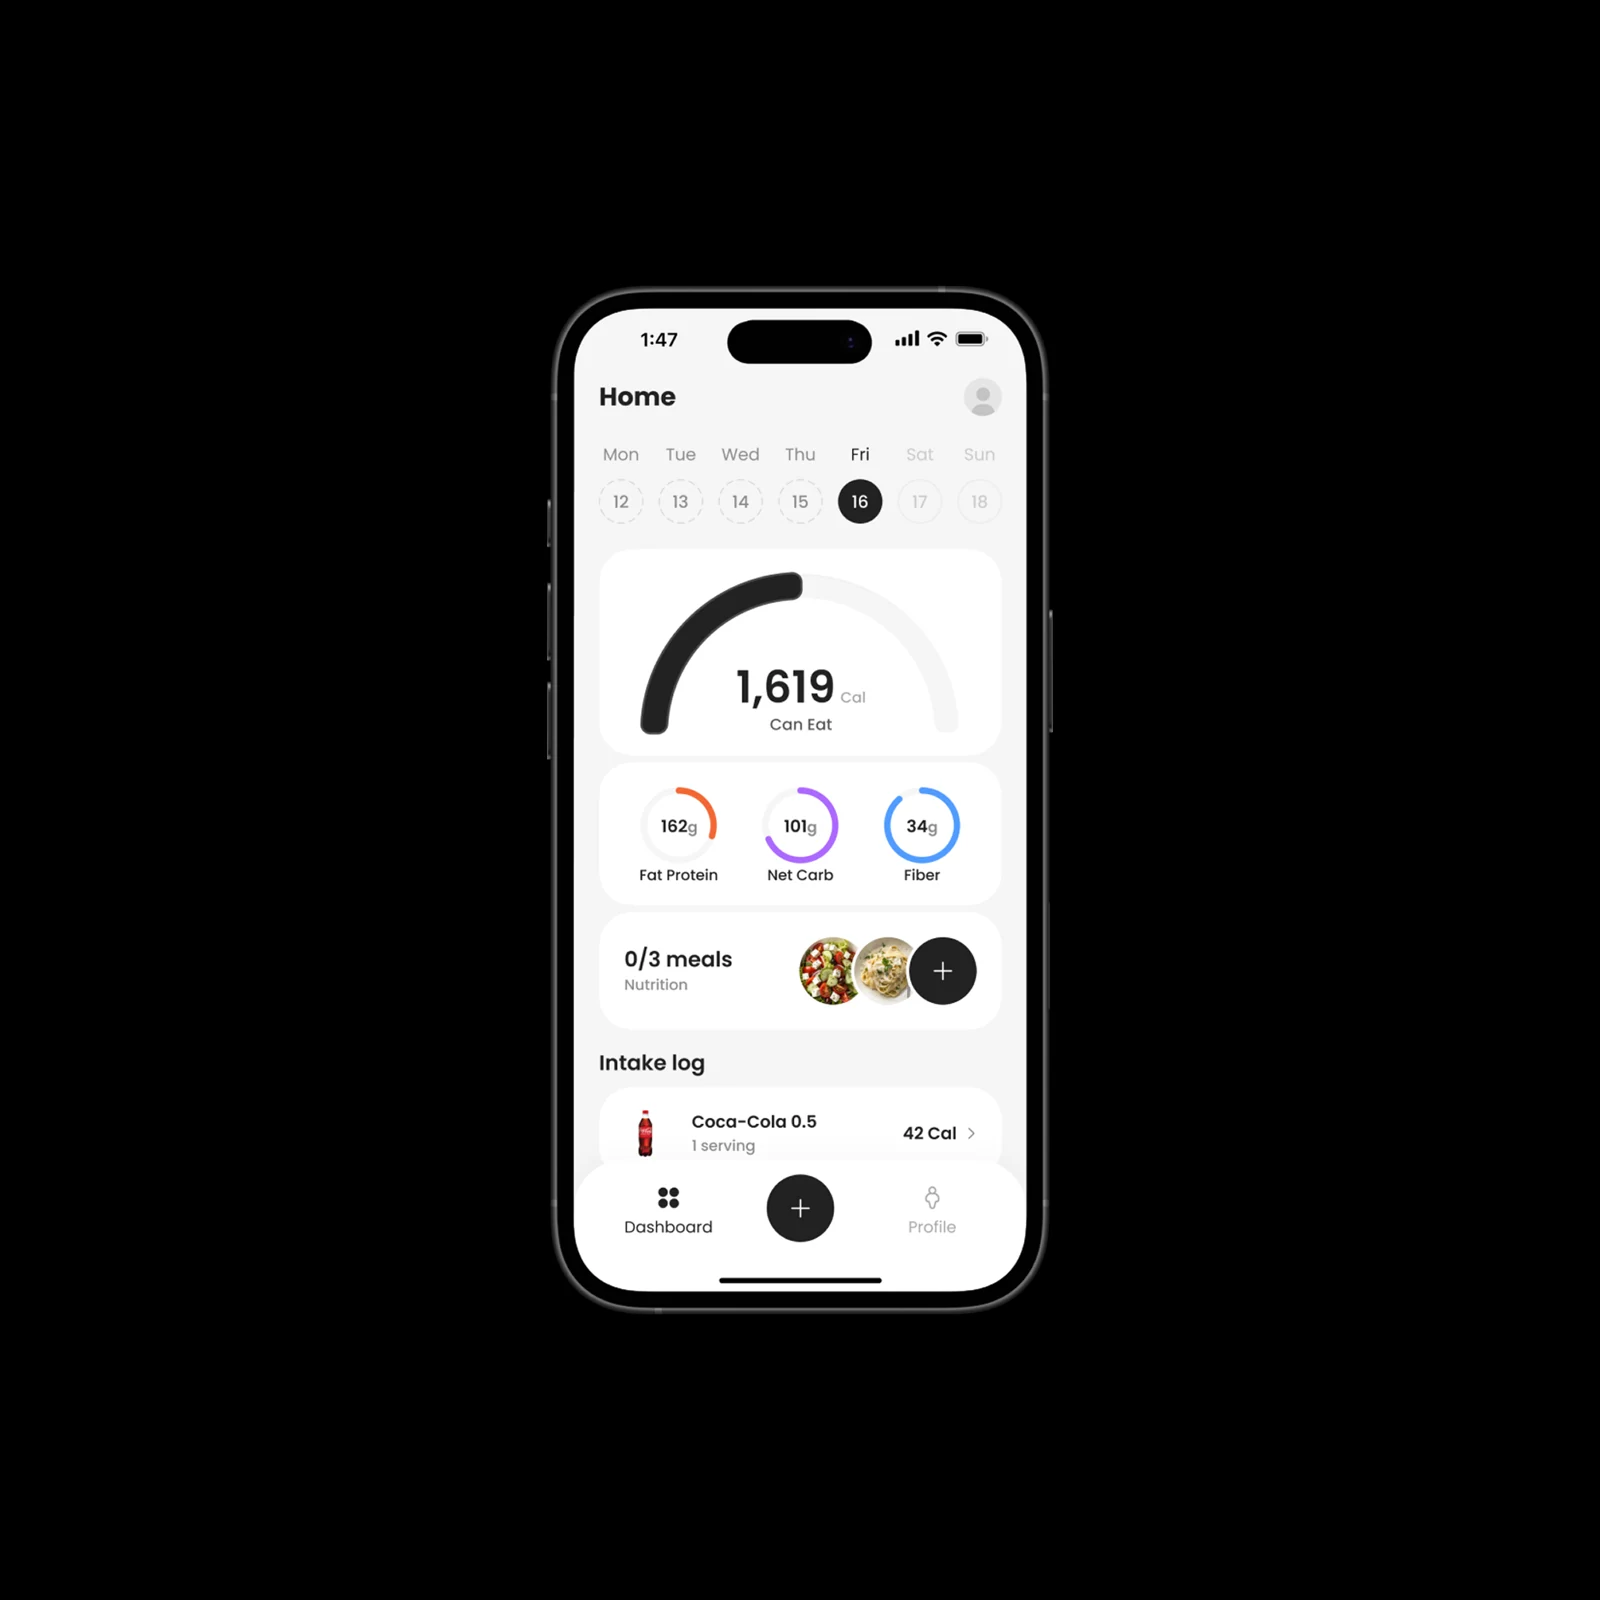
An overview with a clear centre
The daily calorie indicator provides the primary reading. Separate nutrient indicators and the intake log add detail without giving every number the same visual weight.
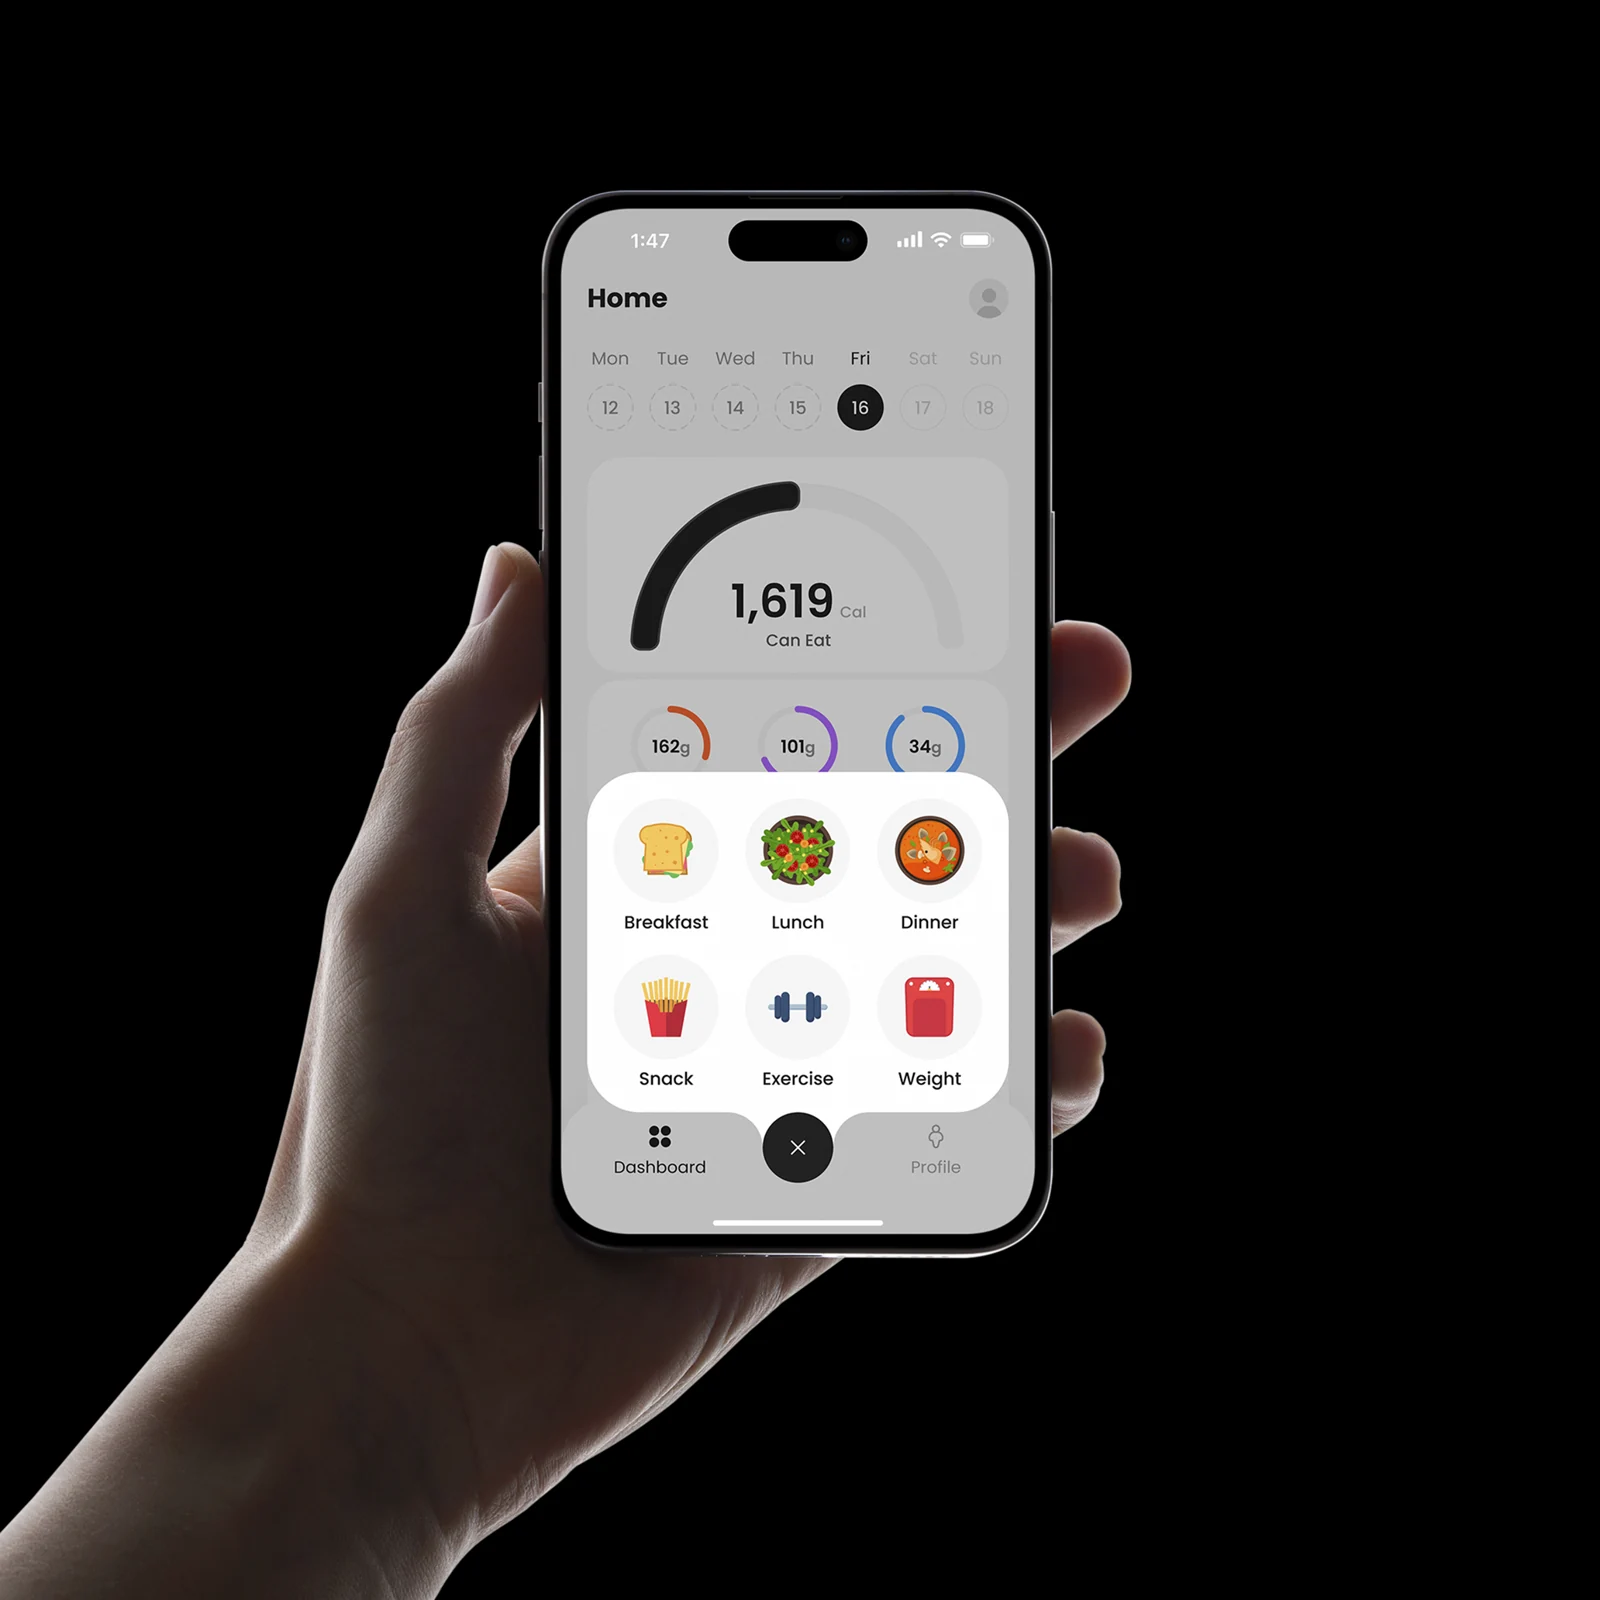
Different entries, one starting point
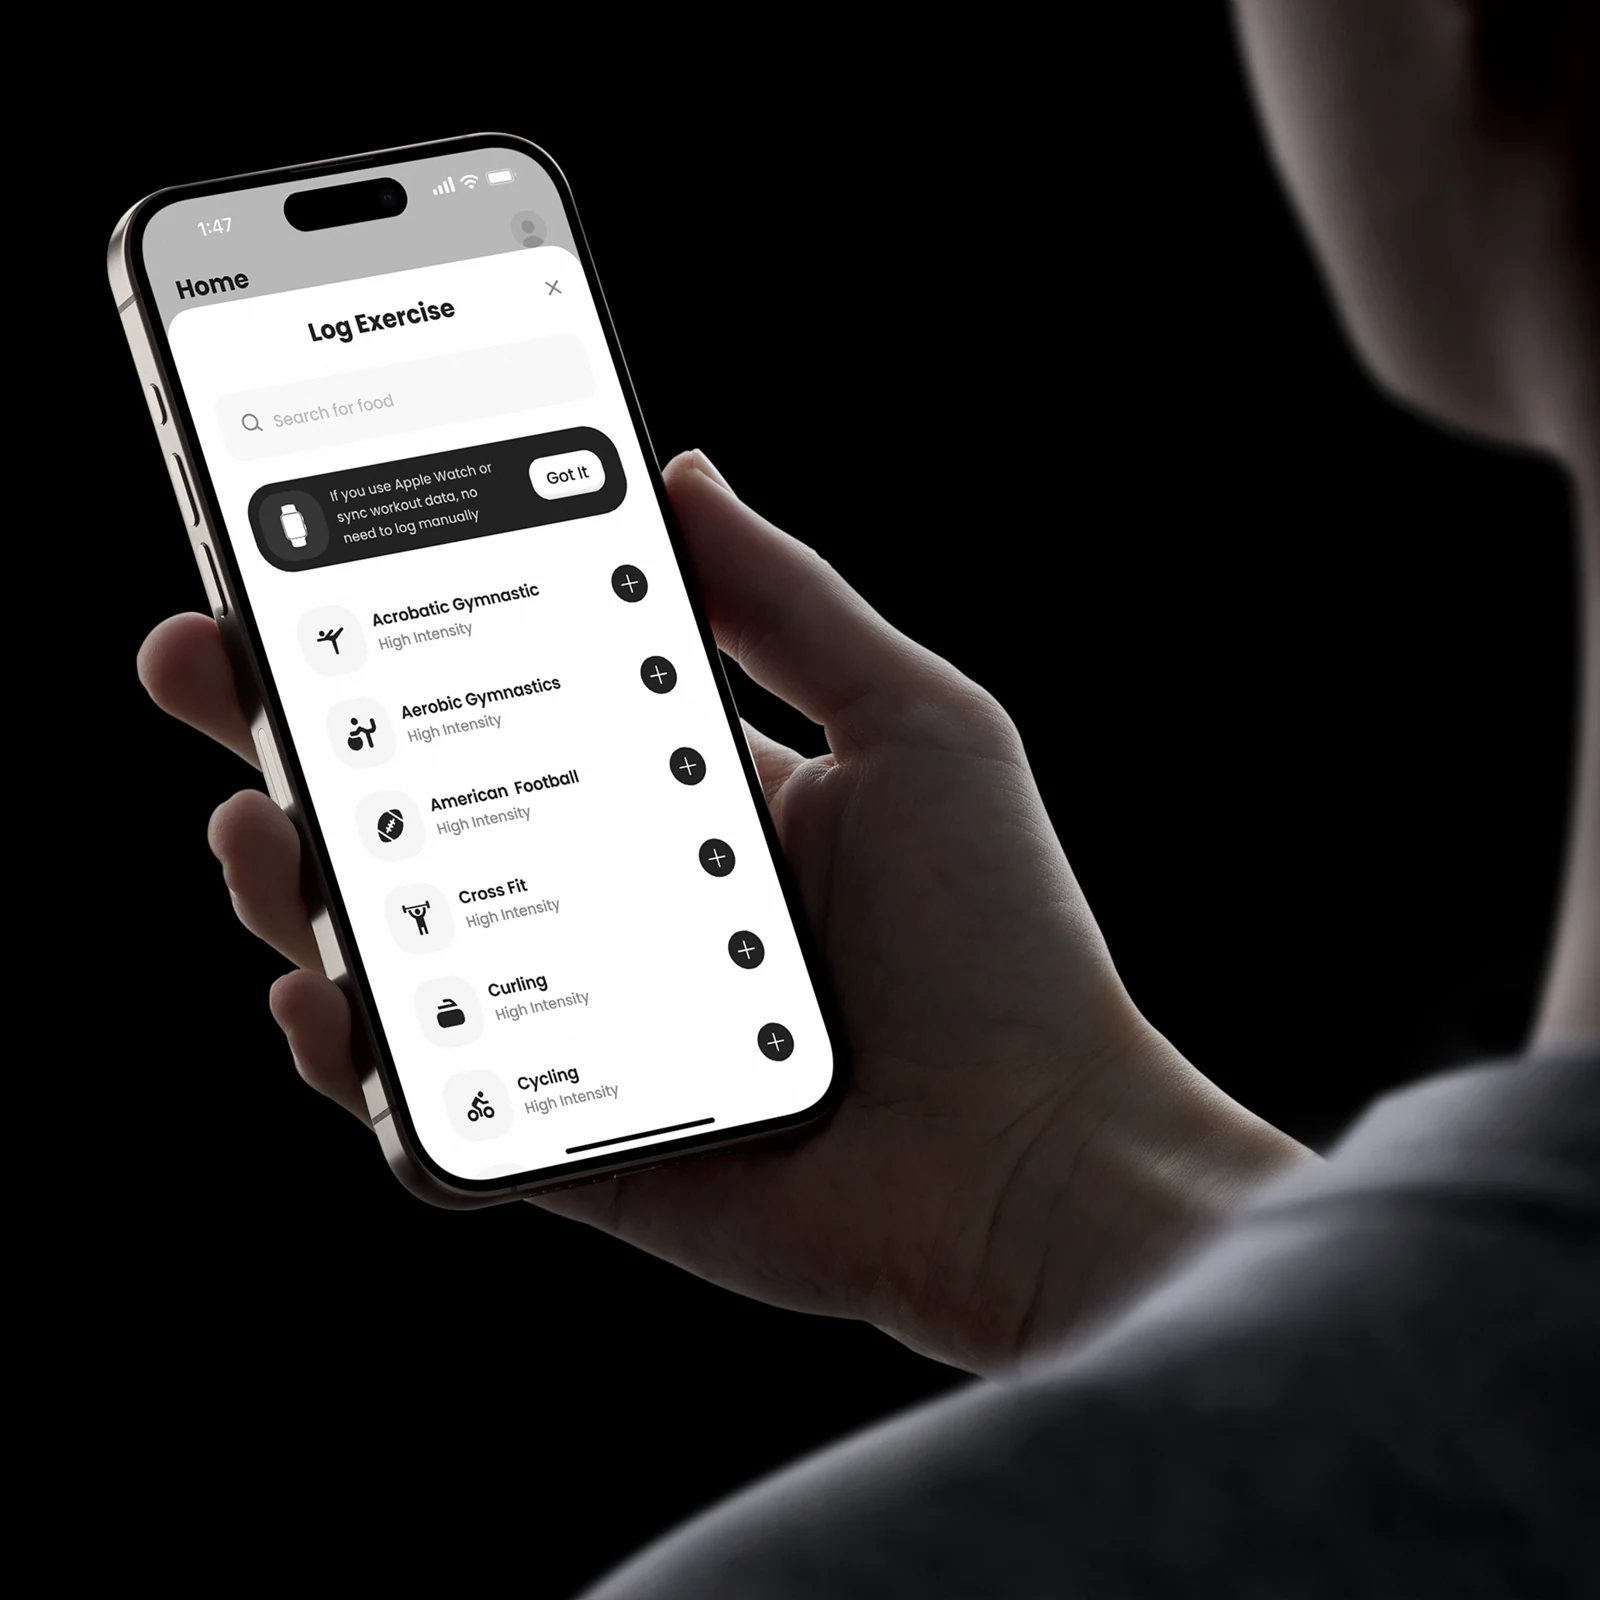
The add menu groups meals, exercise and weight in one surface. Each action uses a recognisable category rather than asking the person to interpret a generic form first.
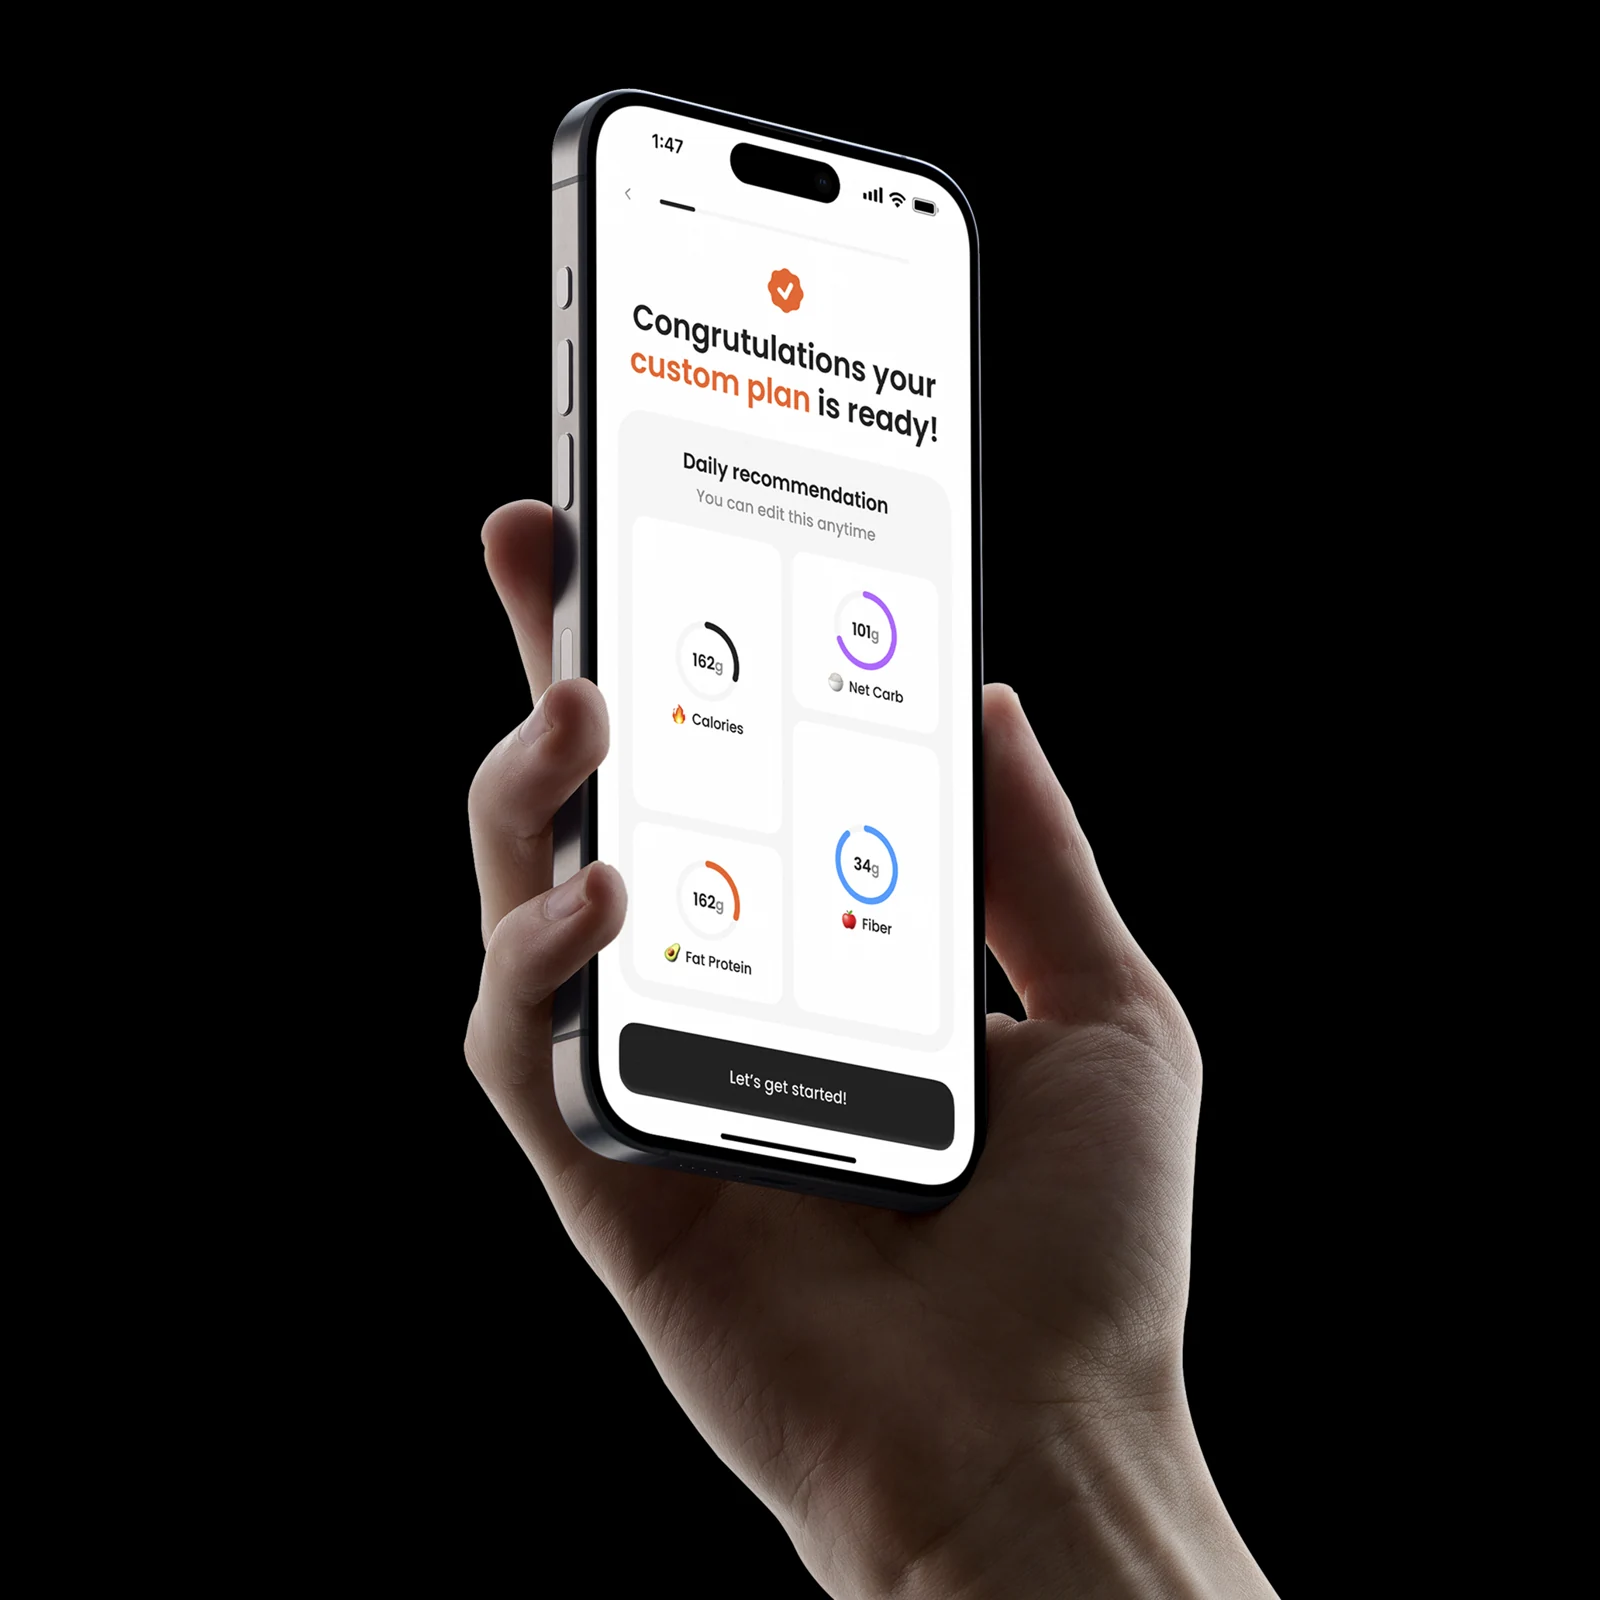
From plan to daily use
A plan summary provides an entry into the daily experience. The supplied onboarding also introduces meal scanning; the case presents that interface without making claims about recognition accuracy.
The key moments, connected.
A presentation of the interface moments shown in this case.
Review the day
Choose an entry
Log a meal or exercise
Update the overview
A closer look at progress.
Different questions deserve different views. Explore the journey, the task and the pattern of return.
First-log activation
+9 pp vs modeled baseline
Follow the steps between an eligible visit and a completed action.
Eligible visits → first-log activation · counts
Day-7 logging return
+5 pp vs modeled baseline
Look at the rhythm of repeat activity, beyond a single headline number.
Activity intensity · day × week
A product experience.
Beyond the presentation.
UX, interface design and development came together in a published product. The existing brand was carried into a more developed interface system. Post-launch support provided time for monitoring, client feedback and continued refinement.
Discuss a project ↗Shark Converter