Shark Converter
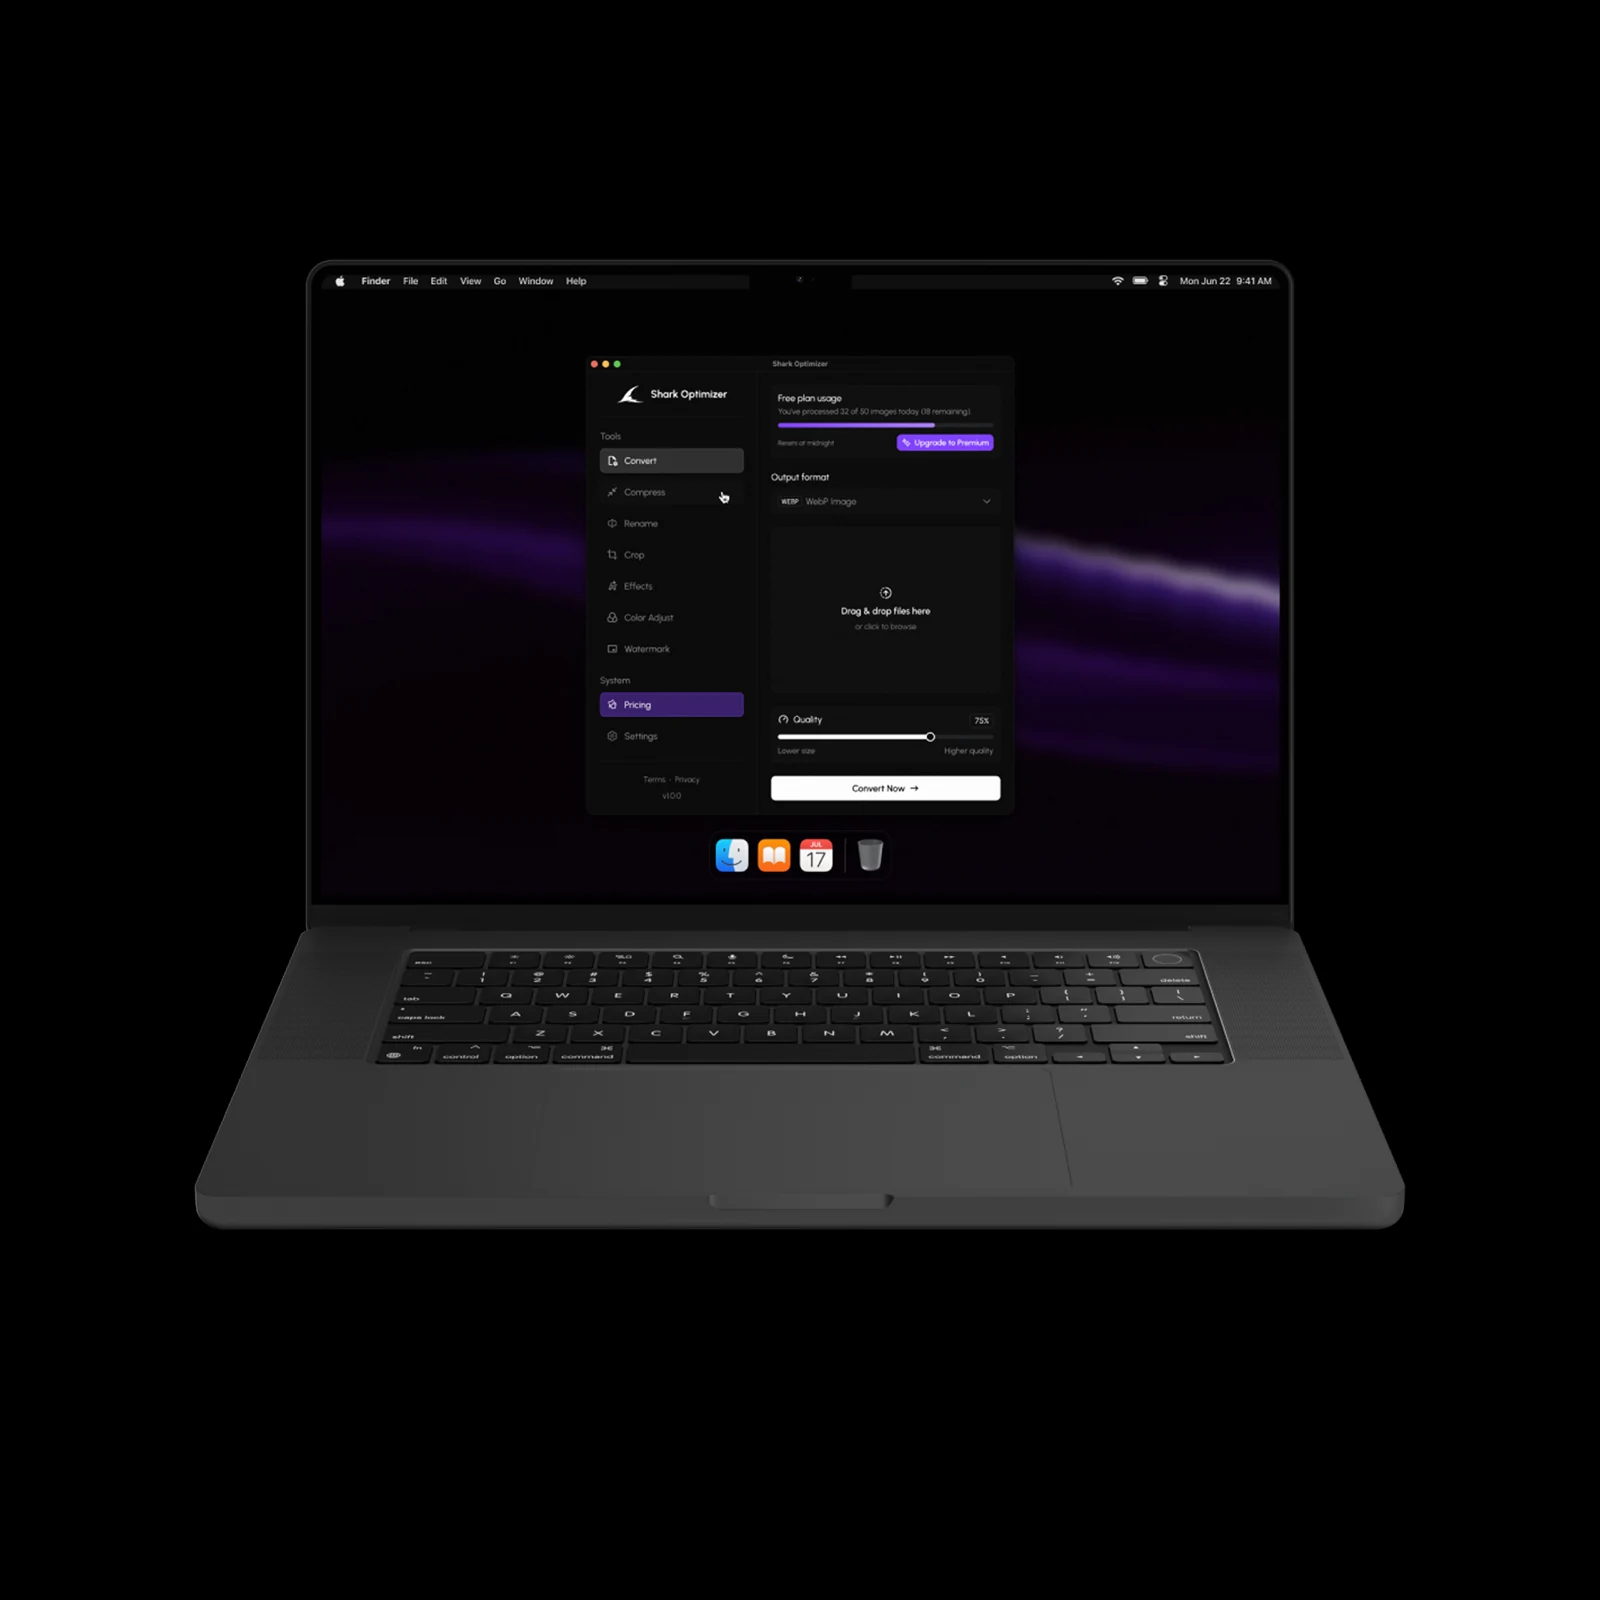
A compact image utility presenting conversion, cropping and colour adjustment in a shared workspace. The supplied interface is labelled Shark Optimizer.
↓
Shark Converter
UX/UI design
Product development
Evolution of the supplied brand
Publication and release
3–6 months of post-launch support
Keep image parameters and the visual preview close enough that each adjustment remains understandable.
The client brought the brand. We developed its expression within the product, designed the experience and built the application. Our engagement continued through publication and a 3–6 month support period, with refinements informed by usage and client feedback. Further support was a separate service.
Decisions you can see in the product.
Tools in a stable place
The sidebar keeps the different image operations in a consistent location. The main area changes with the selected task rather than becoming a single overloaded panel.
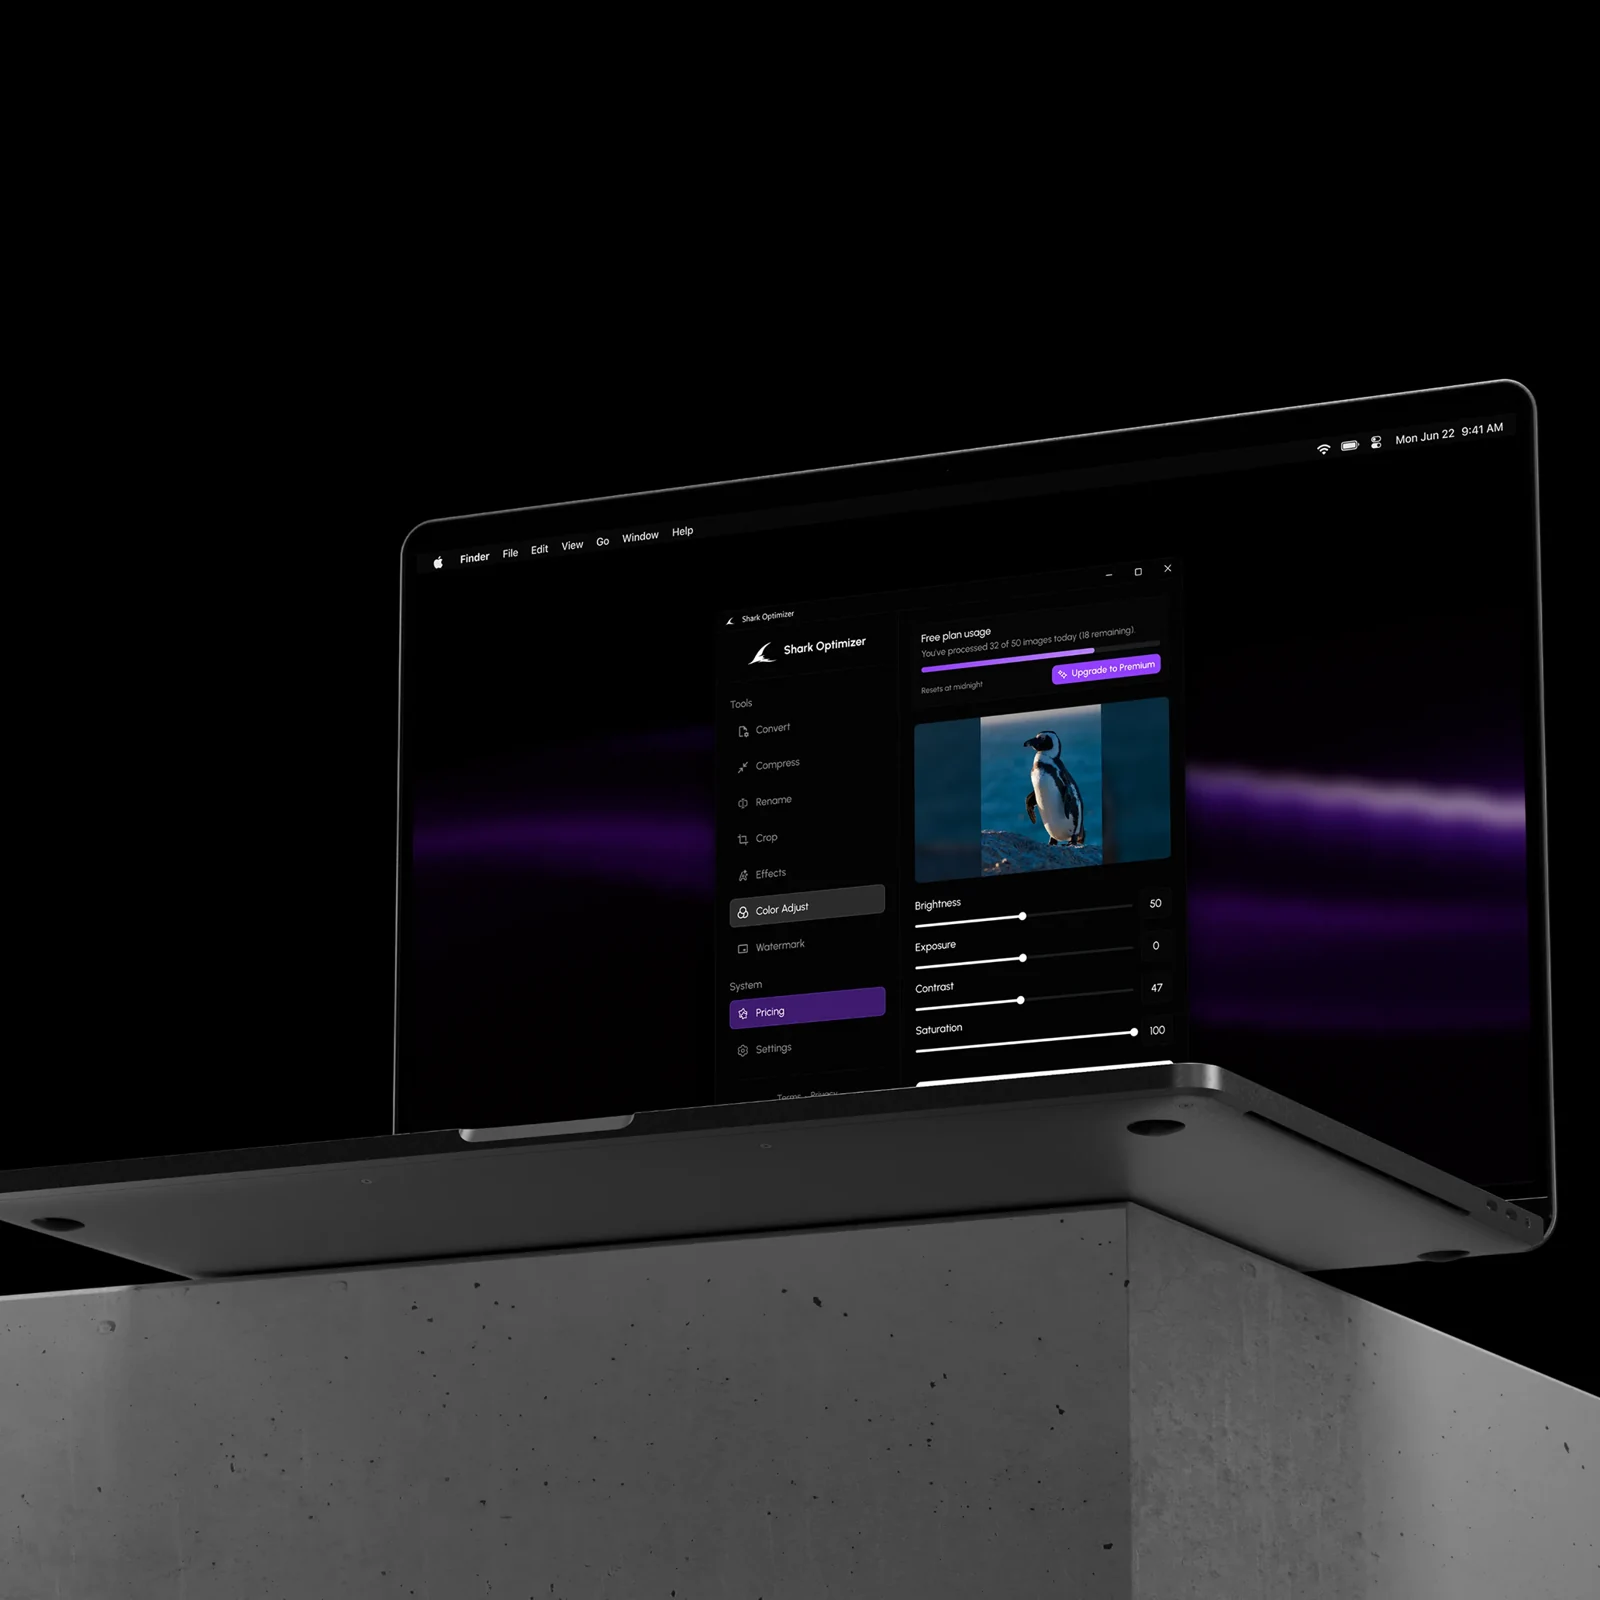
Preview beside precision
The colour-adjustment screen pairs sliders with numeric values. The image remains visible alongside brightness, exposure, contrast and saturation controls.
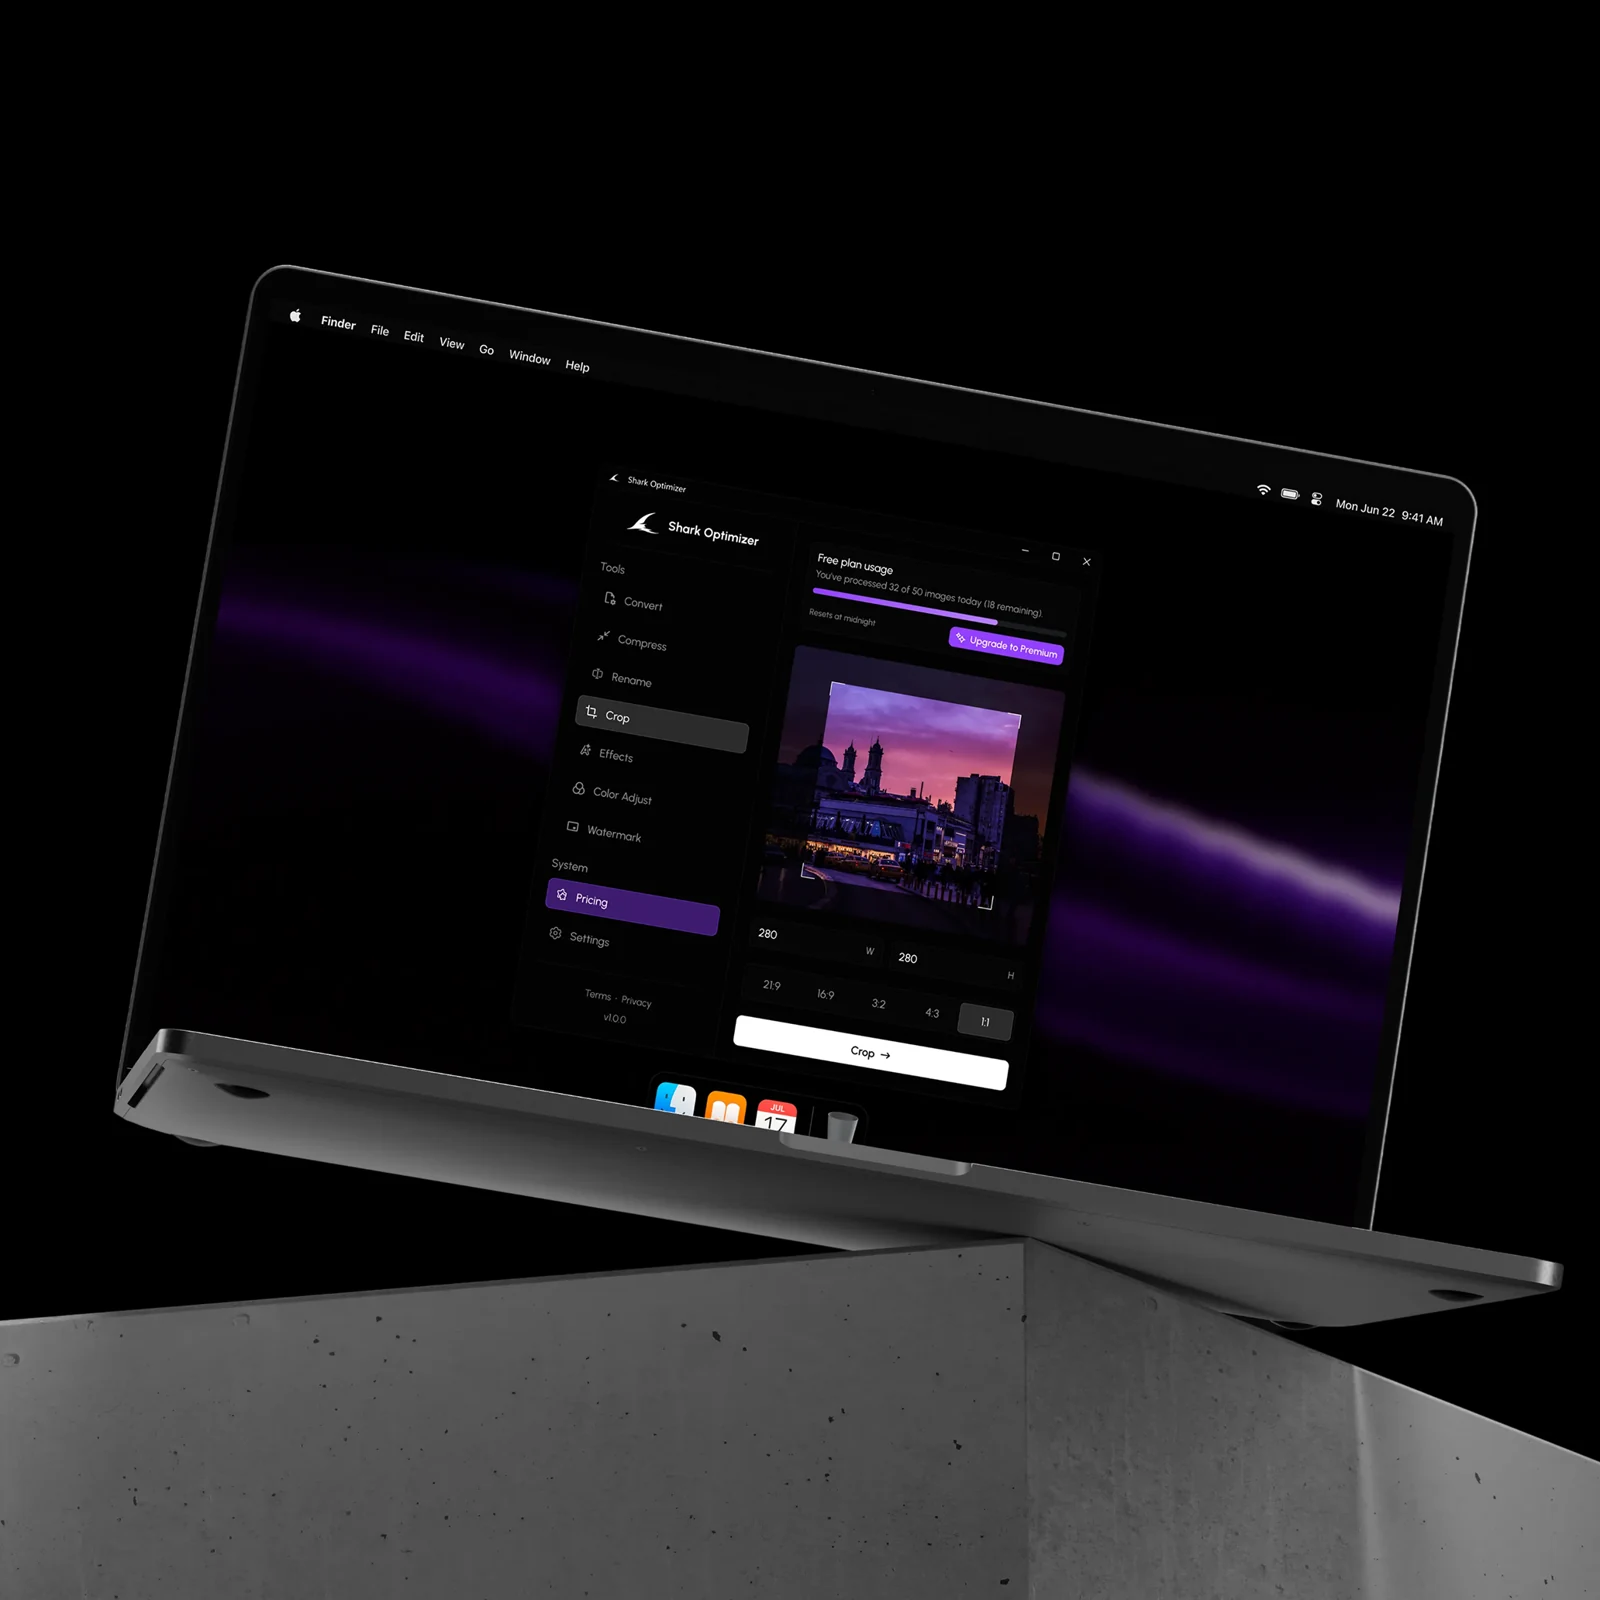
A focused crop workspace
The crop view gives the preview and size controls their own context. A shared control language connects it with the other tools while allowing a different task layout.
The key moments, connected.
A presentation of the interface moments shown in this case.
Import an image
Choose a tool
Adjust the preview
Export
A closer look at progress.
Different questions deserve different views. Explore the journey, the task and the pattern of return.
Export completion
+8 pp vs modeled baseline
See the completed share alongside the remaining opportunity.
Completed86%
Not completed14%
Weekly tool return
+5 pp vs modeled baseline
Look at the rhythm of repeat activity, beyond a single headline number.
Activity intensity · day × week
A product experience.
Beyond the presentation.
UX, interface design and development came together in a published product. The existing brand was carried into a more developed interface system. Post-launch support provided time for monitoring, client feedback and continued refinement.
Discuss a project ↗Motivation App