To-Do Tracker
A daily task interface combining dated lists, task-status filters, a short creation form and a separate progress profile.
↓
To-Do Tracker
UX/UI design
Product development
Evolution of the supplied brand
Publication and release
3–6 months of post-launch support
Make the daily list immediately useful while keeping motivational features out of the way of basic task management.
The client brought the brand. We developed its expression within the product, designed the experience and built the application. Our engagement continued through publication and a 3–6 month support period, with refinements informed by usage and client feedback. Further support was a separate service.
Decisions you can see in the product.
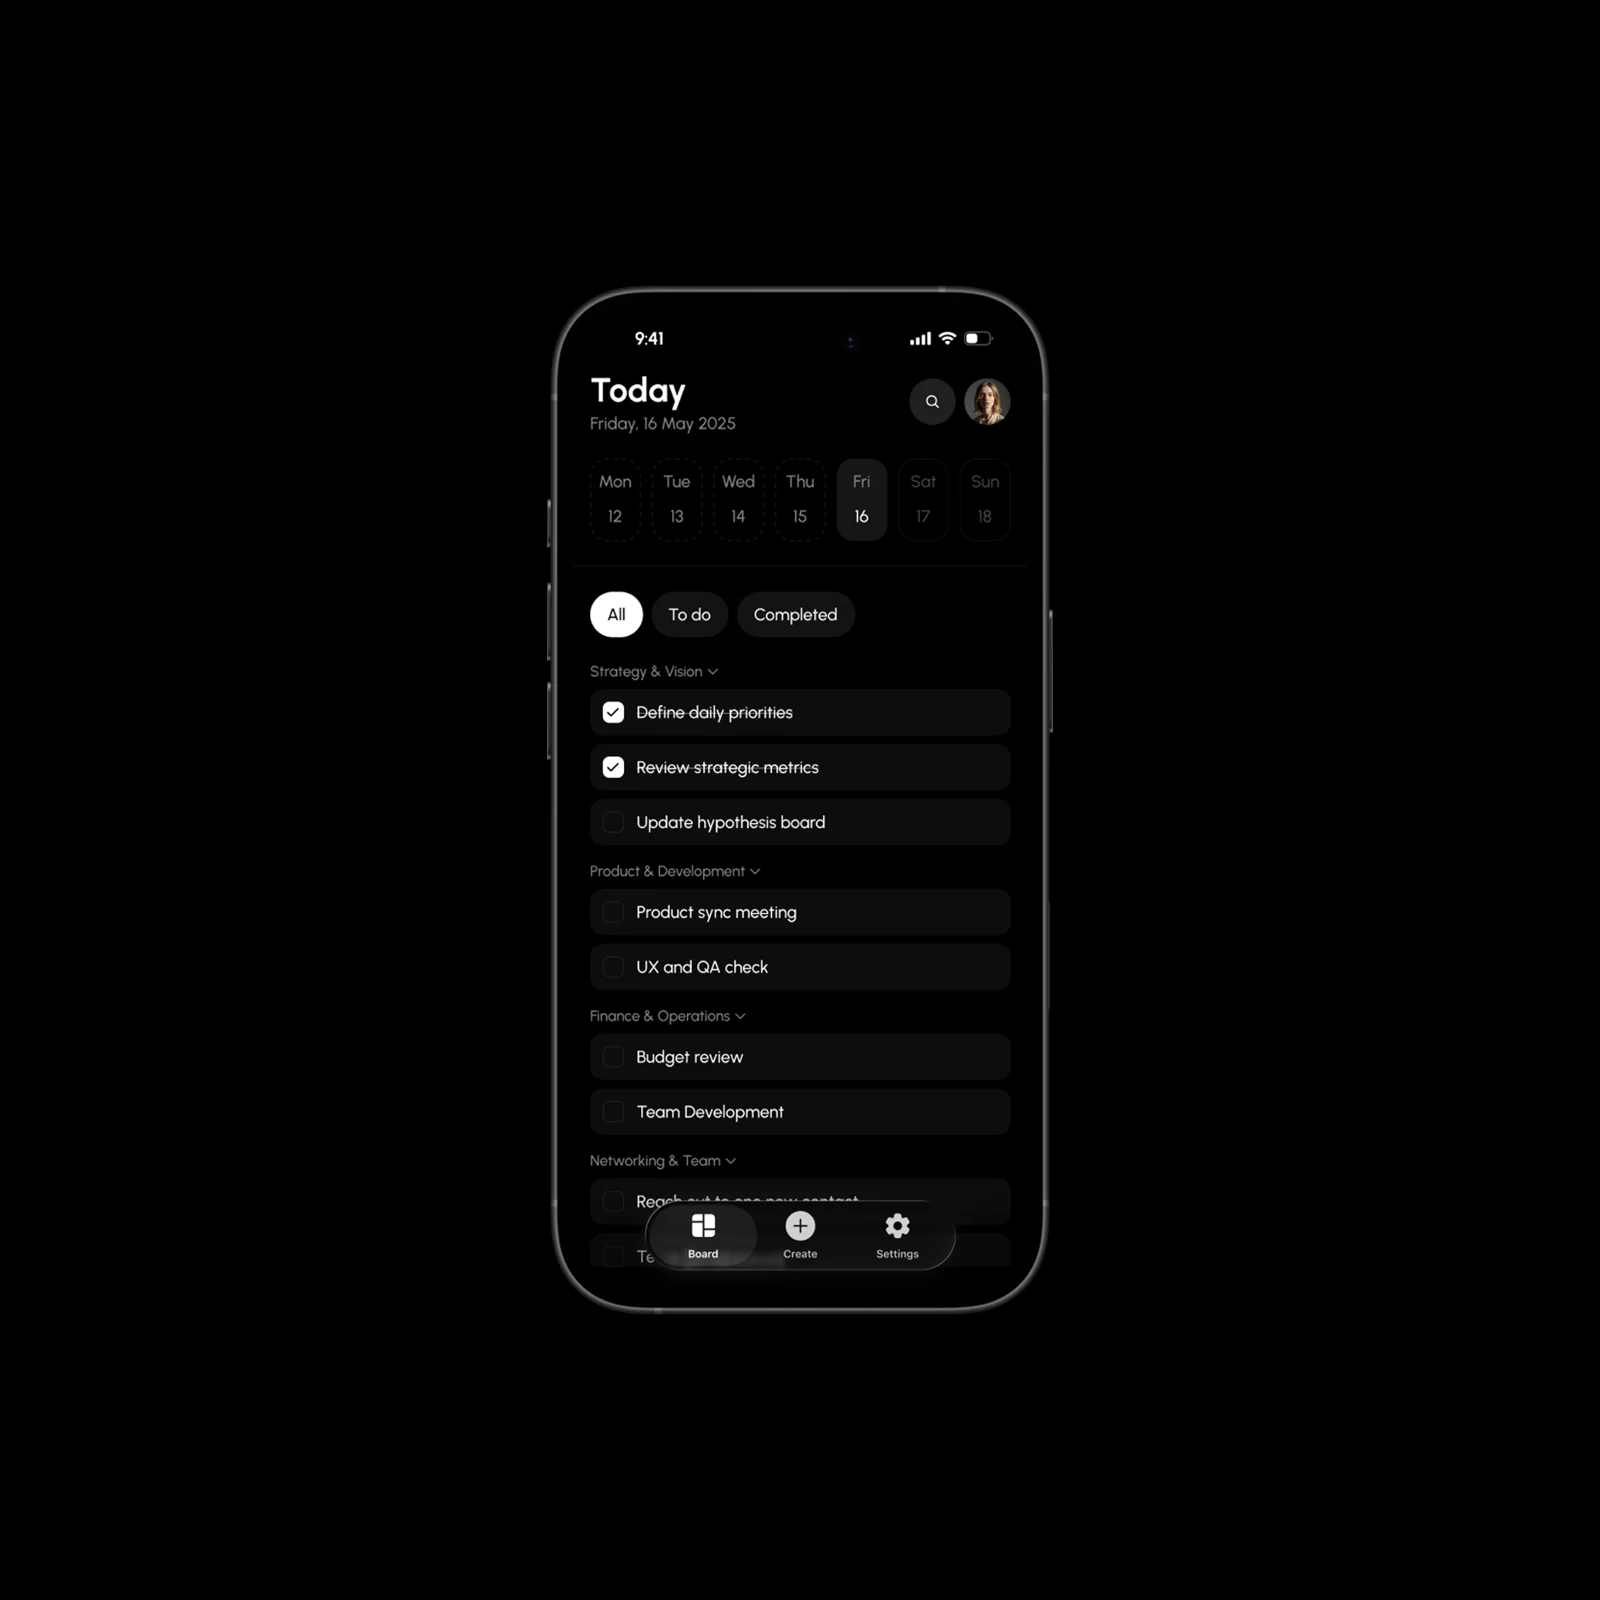
A list that can be scanned
The date selector, status filters and themed groups provide different ways to orient within the task list. Their separation helps preserve the meaning of each control.
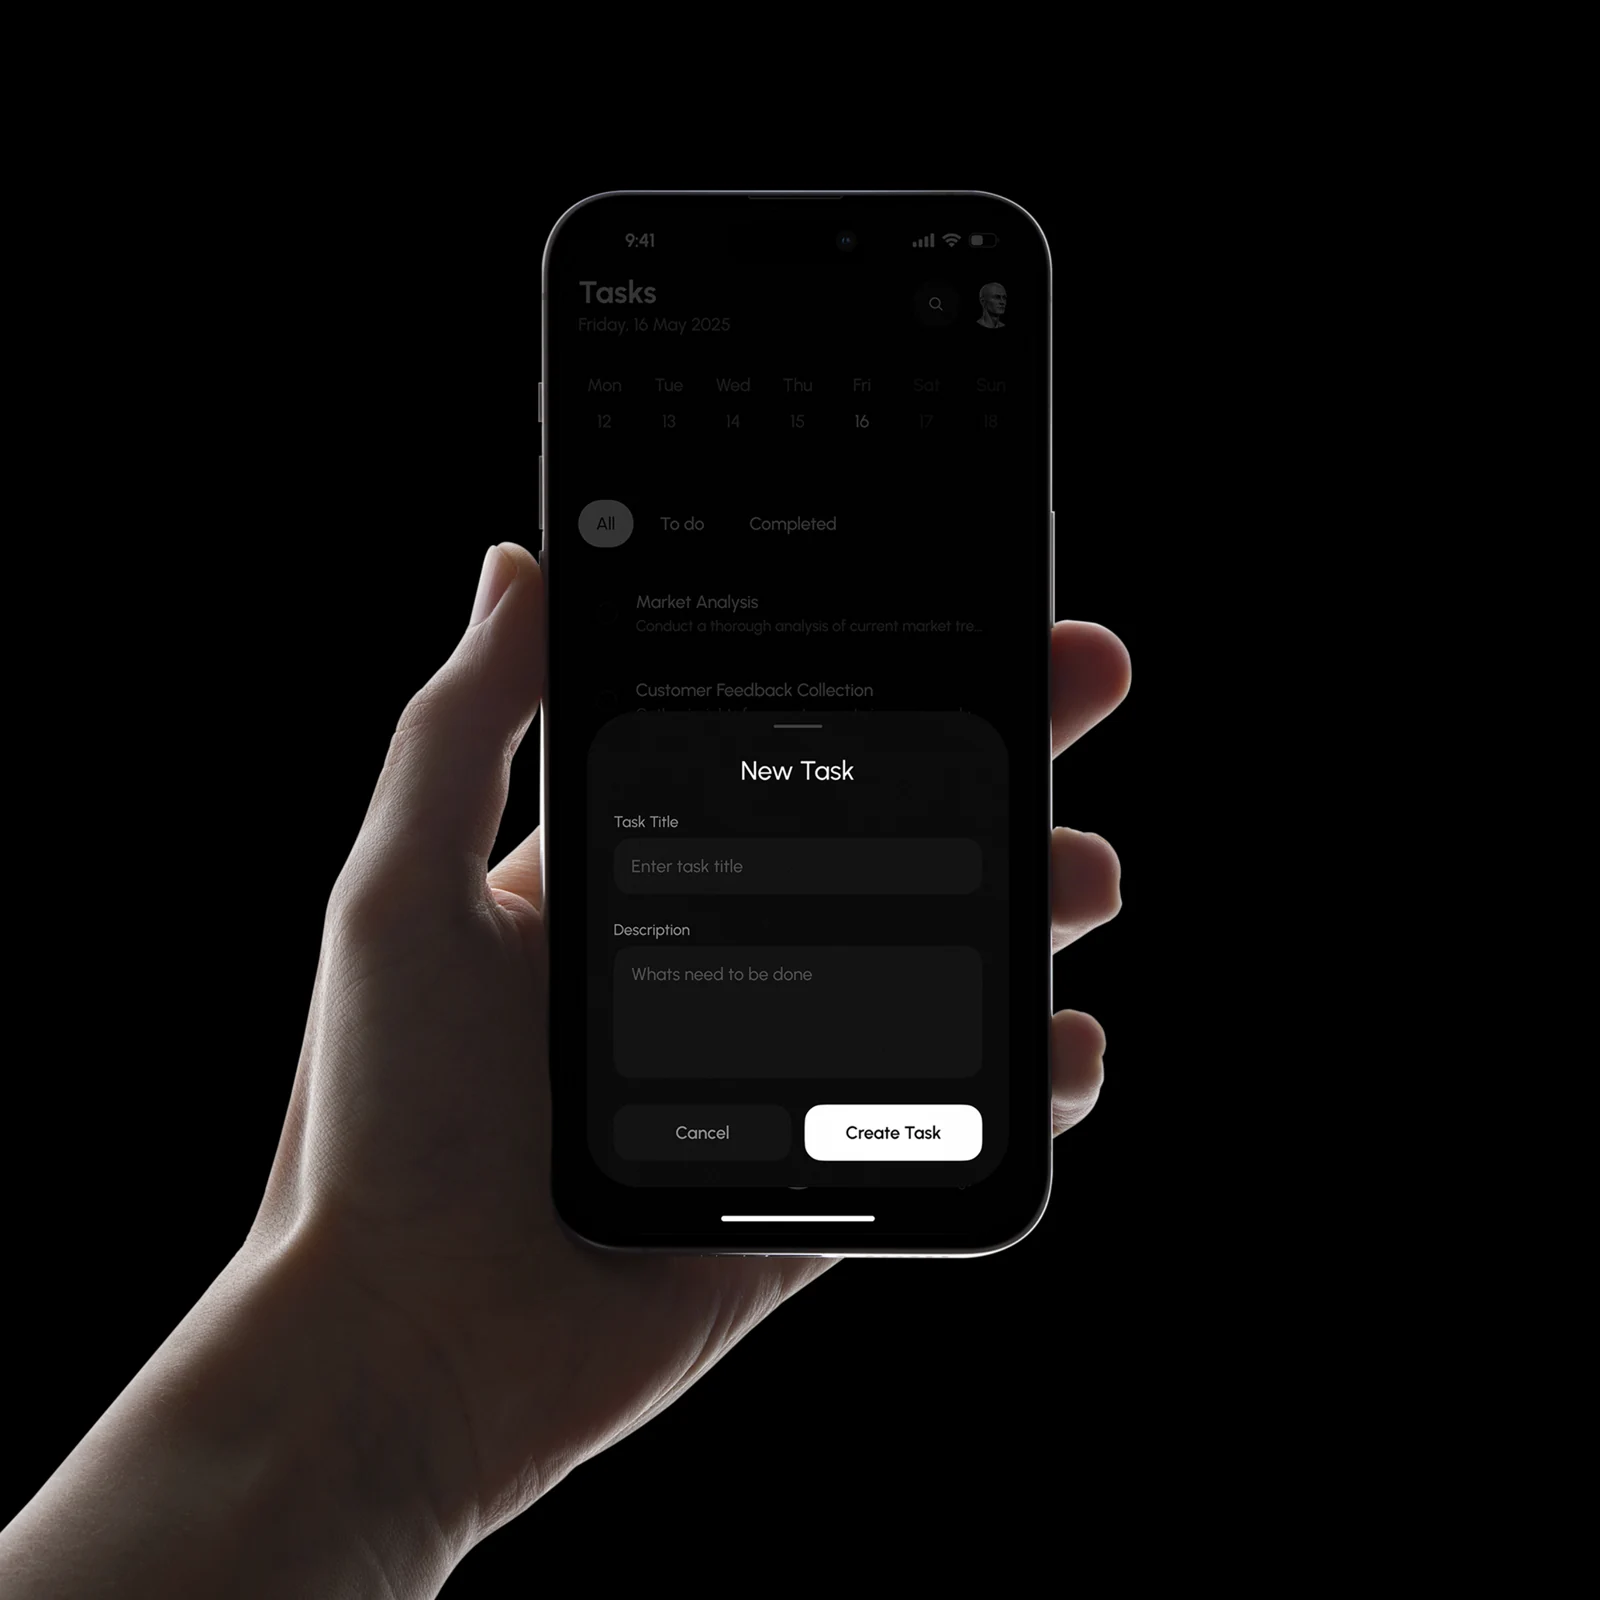
A short route to creation
The New Task sheet focuses on a title, description and a clear Create Task action. It keeps task entry within the context of the list.
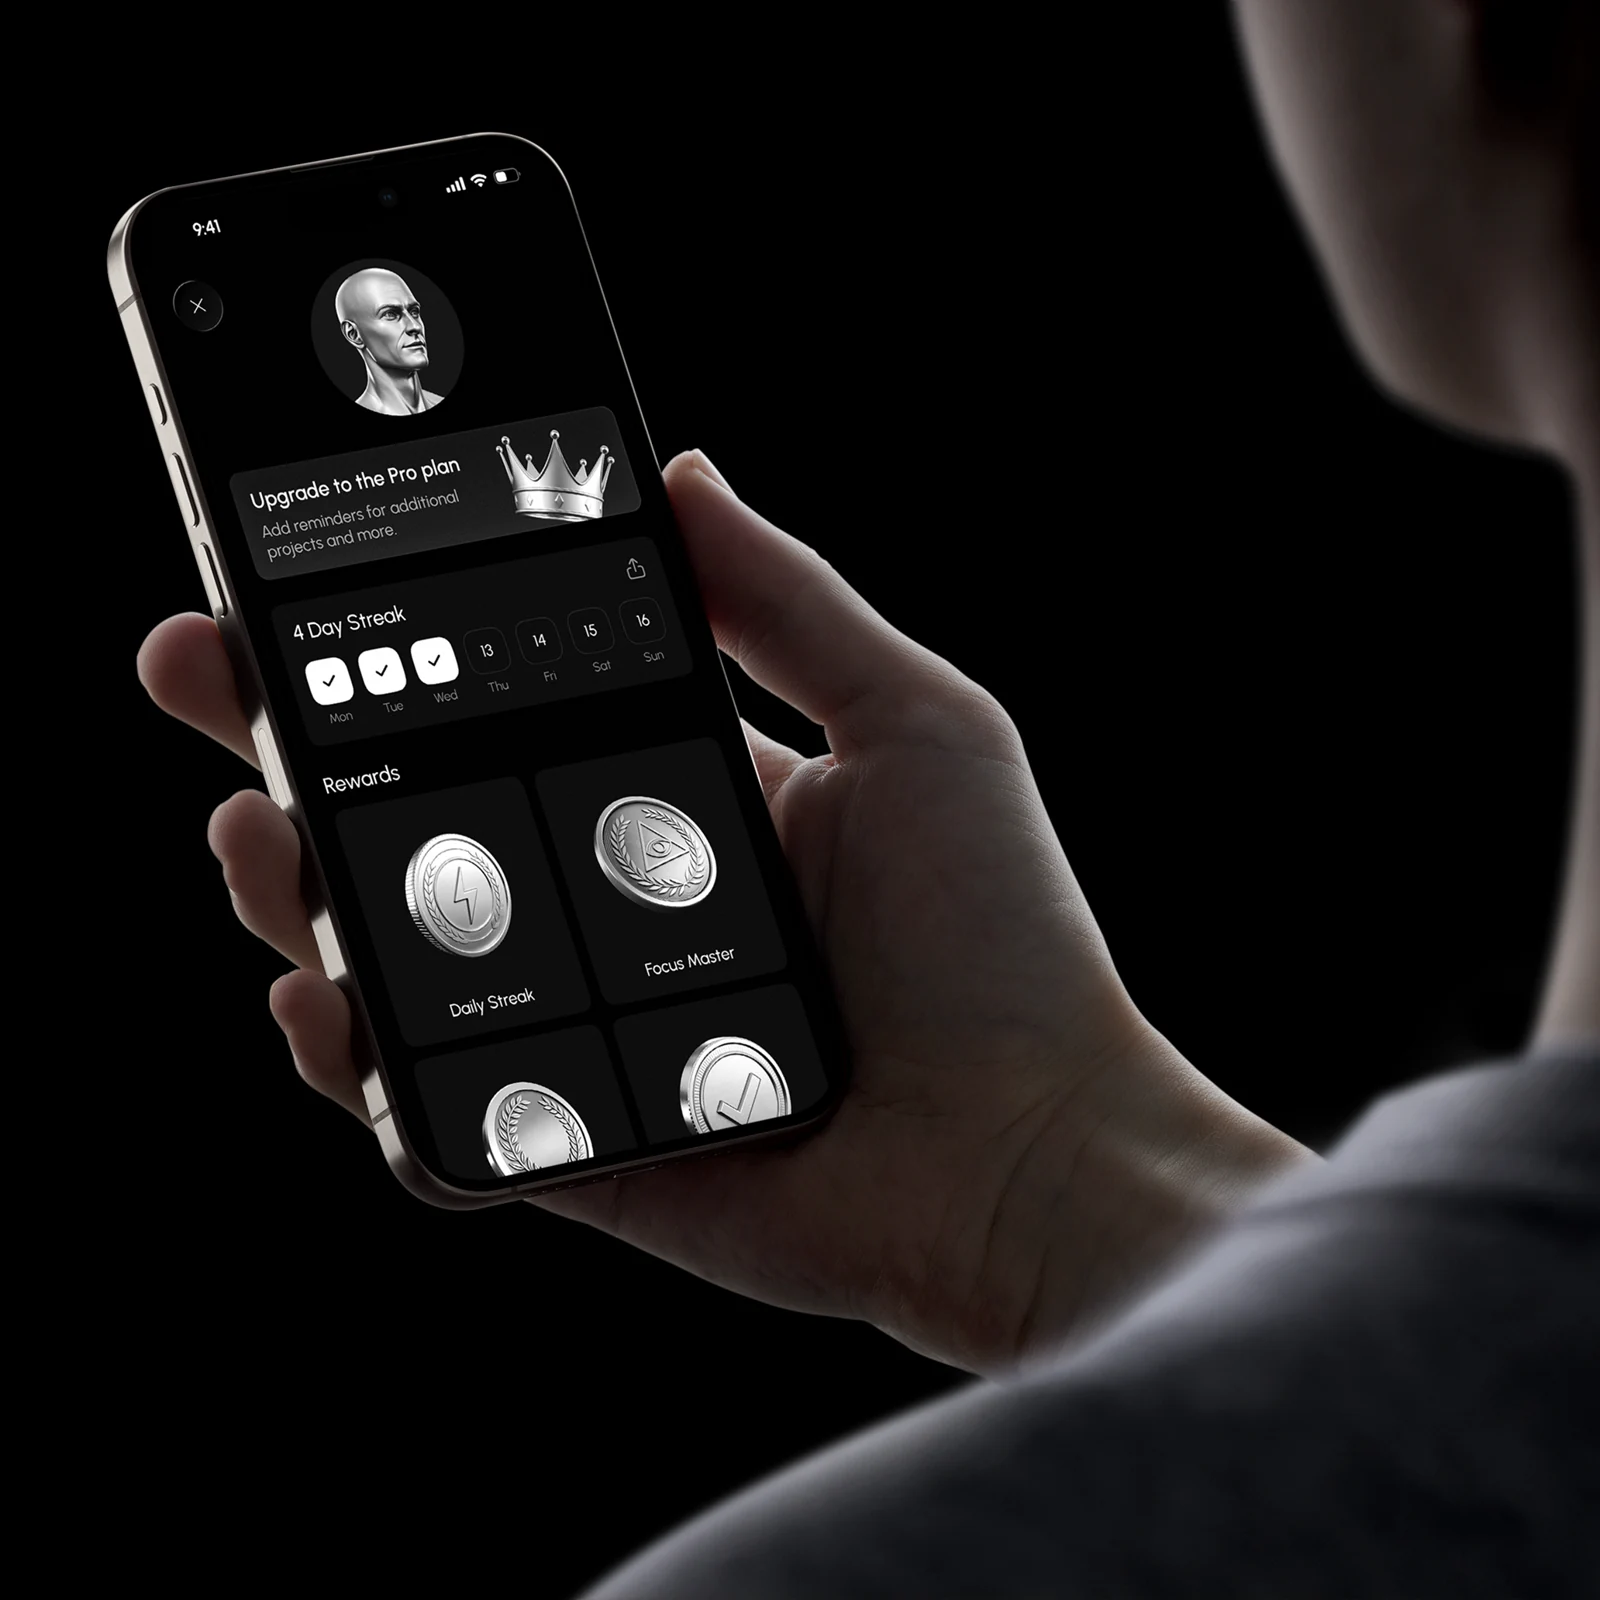
Progress has its own place
The profile houses streaks, rewards and the upgrade entry. These secondary features can support the experience without becoming the main content of Today.
The key moments, connected.
A presentation of the interface moments shown in this case.
Open Today
Create a task
Review the list
Mark complete
A closer look at progress.
Different questions deserve different views. Explore the journey, the task and the pattern of return.
Task creation completion
+10 pp vs modeled baseline
Follow the steps between an eligible visit and a completed action.
Eligible visits → task creation completion · counts
First-day activation
+7 pp vs modeled baseline
See the completed share alongside the remaining opportunity.
Completed41%
Not completed59%
Weekly task return
+6 pp vs modeled baseline
Look at the rhythm of repeat activity, beyond a single headline number.
Activity intensity · day × week
A product experience.
Beyond the presentation.
UX, interface design and development came together in a published product. The existing brand was carried into a more developed interface system. Post-launch support provided time for monitoring, client feedback and continued refinement.
Discuss a project ↗Music Player